[펌] latex에서 subfig 패키지 사용하여 sugfigure 삽입하기
2006. 10. 2. 21:48 in Study Story/Tips
본 글은 http://faq.ktug.or.kr/faq/SubfigPackage 에서 퍼왔습니다.
subfig 패키지가 subfigure를 대체하게 되었네요. 사용법과 명령어가 조금 바뀌었네요.
subfig 패키지가 subfigure를 대체하게 되었네요. 사용법과 명령어가 조금 바뀌었네요.
") subfig 패키지 -> see
subfig 패키지 -> see [edit]
1 Q&A 
Q1: (from변환한 것과 origin을 이용해서 eps 파일을 형성한 것 두 가지가 있습니다. 그림의 레이아웃 형태는
다음과 같습니다.
--------------------------------------------------하나의 그림에 세 개가 삽입된 형태입니다. 그리고, figure 1-b와 figure 1-c가 크기가 다릅니다. 높이는 같은데, 폭이 다릅니다. 이런 경우에는 어떻게 해야할 지 막막하네요... 참고로 그림 파일을 첨부하도록 하겠습니다.===> 첨부하는 방법좀 알려주세요^^ 그럼 도움 부탁드립니다.
(a) figure 1-a
(b) figure 1-b (c) figure 1-c
----------------------------------------------------
Figure 1. caption
A: 우선 subfigure 패키지를 써 보았습니다. 다음을 컴파일하여 보세요. 아래 첨부한 그림과 같이 됩니다. 세 개의 그림을 한꺼번에 첨부하려면 모두 한 폴더에 넣고 폴더 채로 압축하면 됩니다.
\documentclass{article}\usepackage{amssymb,graphicx,subfigure}

%subfig 패키지를 쓰려면 subfigure->\subfig로 바꿈


\begin{document}\begin{figure}[t]

\centering

\subfigure[This is Fig a]

%subfig 패키지를 쓰면 \subfigure->\subfloat로 바꿈

{\includegraphics[width=\textwidth,height=40mm]{fig5a}}\\

%subfig 패키지를 쓰면 \\이 필요 없음 \centering\subfigure[This is Fig b]

{\includegraphics[width=70mm,height=40mm]{fig5b}}

\hfill \subfigure[This is Fig c]

{\includegraphics[width=40mm,height=40mm]{fig5c}}

\caption{$f_L(l)$ and the adjusted frequency histogram of the simulated $L_1$}

\end{figure}\end{document}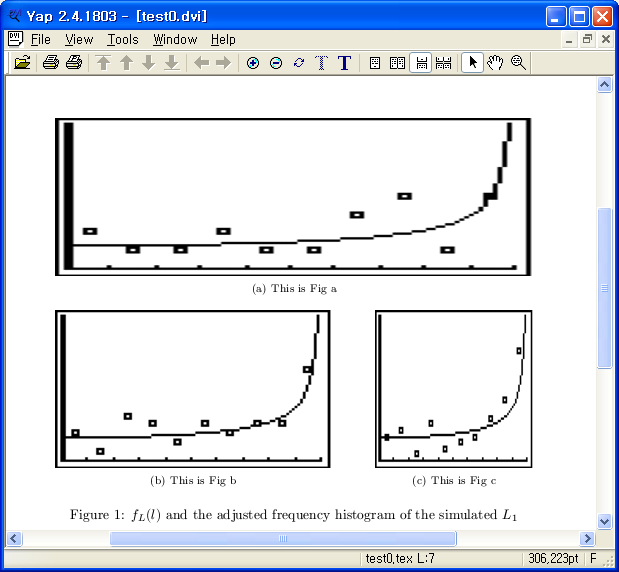
subfig 패키지를 쓸 때는 명령어 등이 조금 다릅니다. 다음을 컴파일하여 보세요.
\documentclass{article}\usepackage{amssymb,graphicx,subfig}

\begin{document}\begin{figure}[t]

\centering \subfloat[This is Fig a]

{\includegraphics[width=\textwidth,height=40mm]{fig5a}}

\centering\subfloat[This is Fig b]

{\includegraphics[width=70mm,height=40mm]{fig5b}}

\hfill

\subfloat[This is Fig c]

{\includegraphics[width=40mm,height=40mm]{fig5c}}

\caption{$f_L(l)$ and the adjusted frequency histogram of the simulated $L_1$}

\end{figure}

\end{document}
Q2: (from  17102) 그림을 가로로 나란히 2개씩 세로 5줄로 되게 총 9개를 배열해야 하는데요.. (중간 생략) 그림이 너무 많아서 한페이지 안에 아주 부자연스럽게 들어가는 군요ㅠㅠ 그림의 높이와 폭은 더이상 줄이면 안되는 상태이구요.. 그림 번호는 그대로 유지하면서 그림 마지막 세개를 다음 장으로 넘기려면 어떻게 해야 할까요? 마지막 그림은 왼쪽으로 붙이고 싶은데 자꾸 중간으로가요..ㅡㅜ.. 첨부 그림: http://www.ktug.or.kr/jsboard/data/operate/files/20060225233634/3-2-1.eps
A: captcont 패키지를 쓰면 됩니다. 다음을 컴파일하여 보세요. 17775) ICASE(제어·자동화·시스템공학회: Institute for Computer Applications in Science and Engineering)의 클래스 파일 icase.cls은 subfig 패키지와 충돌을 일으킵니다. SICE-ICCAS2006.cls도 마찬가지입니다. subfig 패키지 대신 subfigure 패키지를 쓰면 괜찮습니다.
\documentclass{article}

\usepackage{hangul}

\usepackage{graphicx}

\usepackage{captcont}

\usepackage{subfig}

\begin{document}

\begin{figure}

\scriptsize

%\centering

\subfloat[소표본(패턴1)에서 $\beta_{0}$의 $90\%$신뢰구간]

{\includegraphics[width=60mm,height=30mm]{3-2-1}}

\hfill \subfloat[패턴2에서 $\beta_{0}$의 $90\%$신뢰구간]

{\includegraphics[width=60mm,height=30mm]{3-2-1}}\\

\subfloat[대표본(패턴3)에서 $\beta_{0}$의 $90\%$신뢰구간]

{\includegraphics[width=60mm,height=30mm]{3-2-1}}

\hfill

\subfloat[소표본(패턴1)에서 $\beta_{1}$의 $90\%$신뢰구간]

{\includegraphics[width=60mm,height=30mm]{3-2-1}}\\

\subfloat[패턴2에서 $\beta_{1}$의 $90\%$신뢰구간]

{\includegraphics[width=60mm,height=30mm]{3-2-1}}

\hfill

\subfloat[대표본(패턴3)에서 $\beta_{1}$의 $90\%$신뢰구간]

{\includegraphics[width=60mm,height=30mm]{3-2-1}}

\captcont{This is a continued figure.}

\end{figure}

\begin{figure}

\scriptsize

%\centering

\subfloat[대표본(패턴3)에서 $\beta_{2}$의 $90\%$신뢰구간]

{\includegraphics[width=60mm,height=30mm]{3-2-1}}

\hfill

\subfloat[소표본(패턴1)에서 $\beta_{2}$의 $90\%$신뢰구간]

{\includegraphics[width=60mm,height=30mm]{3-2-1}}\\

\subfloat[패턴2에서 $\beta_{2}$의 $90\%$신뢰구간]

{\includegraphics[width=60mm,height=30mm]{3-2-1}}

\captcont*{This is a continued figure (cont.)}

\end{figure}

\end{document}[edit]
2 기타 
[edit]
2.1 icase.cls와 충돌 
(From'Study Story > Tips' 카테고리의 다른 글
| SWOT 분석에 대한 글들을 모아 보았어요~ (0) | 2007.01.30 |
|---|---|
| 청중을 졸게 하는 것은 죄악이다! -강의 유머 기법- (2) | 2006.10.24 |
| [팁&테크] 노트북에서 CM없이 네스팟, SK WIN 사용하기 (0) | 2006.10.01 |
| 포토샾 단축기 모음 (0) | 2006.10.01 |
| [펌] latex에서 multicolumn과 multirow사용예 (0) | 2006.10.01 |

 Rss Feed